How to track your investments: the Invest Hub Excel portfolio file, a Google Sheets tracker and broker statement import
mr.ilkevich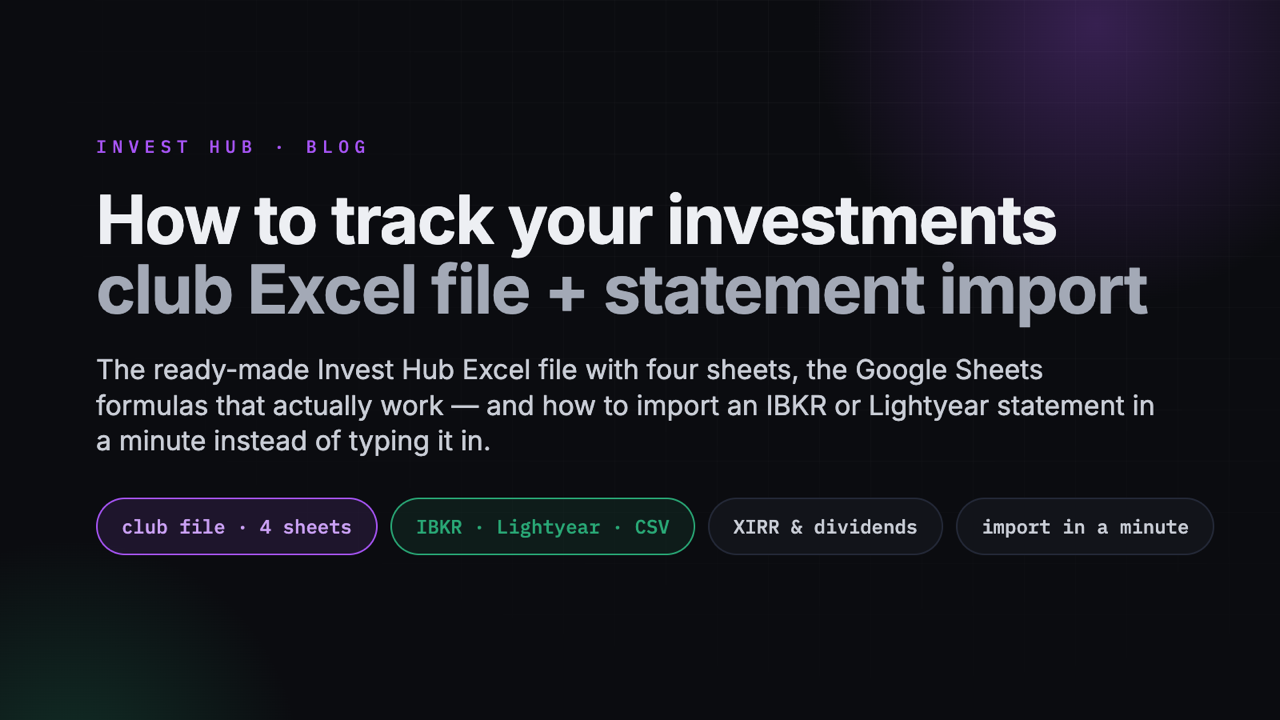
A broker's app only shows what sits with that broker. The moment you open a second account – IBKR for US stocks and Lightyear for ETFs, or an old portfolio next to a new European one – the question "how much have I actually made?" stops having an answer on any single screen. Dividends arrived in dollars, fees were charged in euros, part of a position was sold, and in spring the tax office wants a figure for every trade. Tracking your investments is the habit that answers all of those at once. The club has a ready-made Excel file for it – the Invest Hub portfolio management file – and in this article we take it apart, show how to keep the same tracker in Google Sheets, and how to import a broker statement into InvestHub in a minute instead of typing it in.
The short answer
- Track transactions, not balances. One row per operation – buy, sell, deposit, withdrawal – and everything else (positions, average cost, return) is calculated from that log. A spreadsheet where "current positions" are retyped by hand cannot answer a single question about the past.
- The file already exists. The Invest Hub portfolio management file is four Excel sheets: you fill in Transactions only, and Portfolio, Source and Dashboard work out average prices, profit per stock, XIRR by year and portfolio value by themselves. Club residents download it under "Library → Files".
- Manual entry is the main source of errors. If your broker exports a statement (IBKR, Lightyear and most European brokers do), upload it to InvestHub: the platform recognises trades, dividends, withholding tax and fees by itself, and re-uploading the same statement never creates duplicates.
What a portfolio tracker has to answer
Before opening a spreadsheet, agree on what it is for. A good investment tracker answers four questions – and if your system misses even one of them, it is not a tracker, it is a list of tickers.
- How much went in. Not "what the portfolio is worth" but how much money you put into it – and when. Without those dates, real return cannot be calculated.
- What it is worth now. Every position at today's price, converted into one currency at today's rate. With dollar stocks next to euro ETFs, that alone is a separate task.
- How much was earned. The difference between the first two, plus dividends received, minus fees – and taking into account that money came in at different times. A portfolio that received €10,000 in January and another €10,000 in December did not "grow 5%" because it is worth €21,000.
- How much is tax. Profit on every closed trade and dividends for the year – exactly what goes into the return. In Estonia that happens in February–April, and you pay, not your broker.
Three ways to track a portfolio – and where each one breaks
There are essentially three: look at the broker's app, keep a spreadsheet (your own or the club's file), or hand the job to a service that reads broker statements. Each has a point where it stops working.
| TASK | BROKER APP | SPREADSHEET / CLUB FILE | STATEMENT IMPORT |
|---|---|---|---|
| Several brokers | no – each sees only itself | yes | yes – statements merge into one portfolio |
| Several currencies | at its own rate, no history | a rate per row; the club file uses the Stocks data type | rates are pulled automatically |
| Dividends and fees in the return | often a separate tab, not in the total | yes, if you remember to enter them | yes, from the statement |
| Splits, closed-trade history | yes, within one broker | the club file has a split helper; your own sheet – by hand | automatic |
| Numbers for the tax return | an annual report, format depends on the broker | yes – the trade log is the basis of the return | yes, per closed trade |
| Time per month | 0 minutes | 15–60 minutes, grows with the number of trades | a minute to upload a file |
Our advice is not to choose but to combine. A spreadsheet is worth keeping at least to understand what your return is made of: anyone who has seen their XIRR next to "the portfolio is up X%" never confuses the two again. Statement import removes the routine once you pass a dozen trades a month.
The Invest Hub portfolio file: four sheets, you fill in one
The most common mistake we see in residents' spreadsheets is a "Portfolio" sheet of current positions that gets rewritten after every trade. Such a sheet only knows the present. The club file is built differently: the only place you type is the trade log on the Transactions sheet, and the other three sheets are built from it with formulas. We recommend the same principle for any spreadsheet of your own.
Transactions – the only sheet you type into. Seven columns per row: Type (Buy, Sell or Cashflow), Stock (the ticker), Transaction Date, Shares (negative for a sale), Share Price, Fees and Amount – the deposit or withdrawal, filled in for Cashflow rows only: plus for money in, minus for money out. Everything to the right is calculated: the value of the trade, the cash balance after it, shares held after the trade, profit on a sale, the current price and the value of the position. A separate block on the right is a split helper: ticker, date and multiplier, and the file shows the new share count to paste into the Shares column.
Portfolio – a passport for every stock. One row per ticker: full name and sector, currency and rate, status (open or already closed), first purchase date, average price paid, fees, amount invested; last sale date, average price sold, sales value and realised profit; current shares, price, value and unrealised gain or loss in money and in percent. Further right – the portfolio valuation at the end of every month, which feeds the chart.
Source and Dashboard – what it was all for. Source is the summary: closed and unrealised profit, free cash, total value, invested / received / profit by year, the top 20 positions – and, above all, the XIRR return: all-time, this year and last year. Dashboard boils it down to three numbers – portfolio value (shares plus cash), realised and unrealised profit – and the charts beneath them.
What to know before the first run. The file is built for Excel for Microsoft 365: name, sector, currency and current price are pulled in by the built-in Stocks data type – that is the quote source. In Google Sheets and older Excel versions those fields stay empty; there, use the GOOGLEFINANCE variant in the next section. The file ships with sample trades from 2020 (TSLA, AAPL, NFLX and others) – delete them and enter your own without touching the formula rows; keep your own events in the split helper. Where to get it: residents find it in the club app under "Library → Files" as the portfolio management file; the budget and property-portfolio files sit next to it. Not a resident yet – join the club: the file opens together with the rest of the tools.
If you are in Google Sheets: same principles, four formulas
The club file's principle can be rebuilt in Google Sheets in an evening: a "Log" sheet with one row per operation and a "Positions" sheet that is not typed in but calculated. Four formulas cover ninety percent of the job.
- Units held – buys minus sells per ticker:
=SUMIFS(Log!D:D, Log!C:C, A2, Log!B:B, "buy") − SUMIFS(Log!D:D, Log!C:C, A2, Log!B:B, "sell"). - Current price –
=GOOGLEFINANCE("NASDAQ:AAPL", "price")for US stocks and=GOOGLEFINANCE("FRA:VWCE", "price")for European ETFs; the exchange rate –=GOOGLEFINANCE("CURRENCY:USDEUR"). This replaces the Stocks data type of the club file. - Average cost – the sum of (quantity × price + commission) over buys, divided by the units bought. Include the commission in the cost basis: that is how the tax office counts it too.
- Real return –
=XIRR(cashflows, dates): every deposit with a minus sign, withdrawals and dividends with a plus, and the last row is today's portfolio value with today's date. This is exactly what the Source sheet of the club file computes – and the figure is usually noticeably humbler than "the portfolio is up X%".
One note on separators: spreadsheets with an English locale separate function arguments with a comma, as above; Estonian, German or Russian locales use a semicolon. When a formula "does not work", nine times out of ten this is why.
Five mistakes that make a spreadsheet lie
- Return without dividends and fees. A portfolio of dividend stocks can "stand still" on price and still pay 4% a year – a sheet that only looks at quotes will not see it. Fees, in turn, quietly eat a percent or two from active traders. The club file has a Fees column for this – do not leave it empty.
- Currencies at today's rate. If last year's dollar purchases are converted at today's rate, part of the "profit" is just EUR/USD moving. The rate is fixed on the date of each operation.
- Forgotten splits. After a 10:1 split you hold ten times more units at a tenth of the price – and in a sheet where the split is not recorded, the position "fell 90%". The club file solves this with the split helper; in your own sheet it is a separate row.
- Deposits confused with purchases. You wired €1,000 to the account and bought €1,000 of an ETF – in the log those are two different rows: Cashflow and Buy. Record only the second and XIRR will assume the money appeared out of thin air.
- Manual entry. A mistyped price, a trade entered twice, a forgotten $3 dividend – each error is small, but by tax season a dozen have piled up. Which is why the next section is about statements.
Broker statement import: a minute instead of an evening
Every European broker produces an account statement that already contains everything we suggested typing in above: trades, dividends, withholding tax, fees, deposits. The only question is exporting it correctly and reading it correctly. In InvestHub the importer lives under "Portfolio" → "Import statement": drop the CSV, pick the broker, check the preview – and the portfolio is built. The platform needs no access to your brokerage account, no logins and no API keys – just the file.
Interactive Brokers. In Client Portal: Performance & Reports → Statements → Activity. Choose the period (ideally "since inception" so the history is complete), the CSV format – and upload the file as "IBKR (Activity Statement)". The importer reads trades, dividends, withholding tax, fees, interest, deposits and withdrawals; options come through with the correct contract multiplier. How the broker itself works – in our IBKR review.
Lightyear. In the app you need the "Account statement" as CSV. The "Income" and "Capital gains" reports are not suitable for import: they hold annual totals, not trades, and the platform will tell you so. From the statement it reads buys, sells, dividends, interest, deposits, withdrawals and currency conversions. More on the broker – in our Lightyear review.
IntelInvest. If you kept your records there, the full history export uploads as is – the portfolio moves over with its past trades. Any other broker – and your own spreadsheet. Save the trade log as a CSV with the columns date, type, symbol, quantity, price, currency, commission, fx_rate, notes (types: buy, sell, dividend, coupon, deposit, withdrawal, fee, split) and upload it as "Other broker (CSV)" – a sample with example rows: investhub-portfolio-template.csv. The Transactions sheet of the club file moves over the same way: rename the headers to match the sample and split the Cashflow rows into deposit and withdrawal. What does not work: a bank statement for a payment account – it has no quantities or prices; you need the securities account statement.
Then comes what the club file does – only without formulas on your side. The platform calculates P&L per position and for the whole portfolio, draws monthly returns as a heatmap like a fund report, breaks allocation down by sector, asset class and currency, and keeps the history of closed trades with the result of each. And once you tell the AI consultant your weights, you can ask whether a sector is overheated or what to do with a position that has slumped – and get the reasoning, not a "buy/sell". What else the platform does – on the features page.
Tracking and taxes: why all this matters in spring
The trade log is the draft of your tax return. In Estonia, on an ordinary brokerage account you declare the profit on every sale (sale price minus purchase price minus fees) and the dividends received – the Portfolio sheet of the club file shows exactly those figures for every closed position. On an investment account – investeerimiskonto – only cash in and cash out are counted, and the tax is deferred until you withdraw more than you put in: those are the Cashflow rows. Either way you need the log with dates, fees and the exchange rate on the trade date, because EMTA counts in euros. Rates for ten European countries are in our 2026 table – along with why a W-8BEN on file with your broker saves 15% on US dividends.
Takeaways
- A log, not balances. One row per operation, positions calculated by formulas – the only way a spreadsheet answers about today and about last year.
- The club file does it for you. Four sheets, one to fill in; average prices, profit per stock, XIRR by year and a dashboard – ready. Residents: "Library → Files".
- XIRR instead of "up X%". The only honest return figure for a portfolio funded in instalments – in Excel, in Google Sheets and on the platform.
- A statement beats manual entry. IBKR, Lightyear and IntelInvest directly, everyone else and your own spreadsheets through CSV; splits, FX rates and duplicates are the platform's problem, not yours.
- Tracking is also the tax return. Keep the log all year and taxes take half an hour in spring, not a weekend.
If this was useful – in the Invest Hub club we keep our own portfolios the same way and show them to residents in full: trades, dividends, mistakes and monthly results. The portfolio file, statement import and the AI consultant open together with residency. You can join here.
This material is for information only and is not investment or tax advice. The file, import and analytics features are described as of August 2026; broker statement formats change – if your file is not recognised, send us a sample and we will add the format.